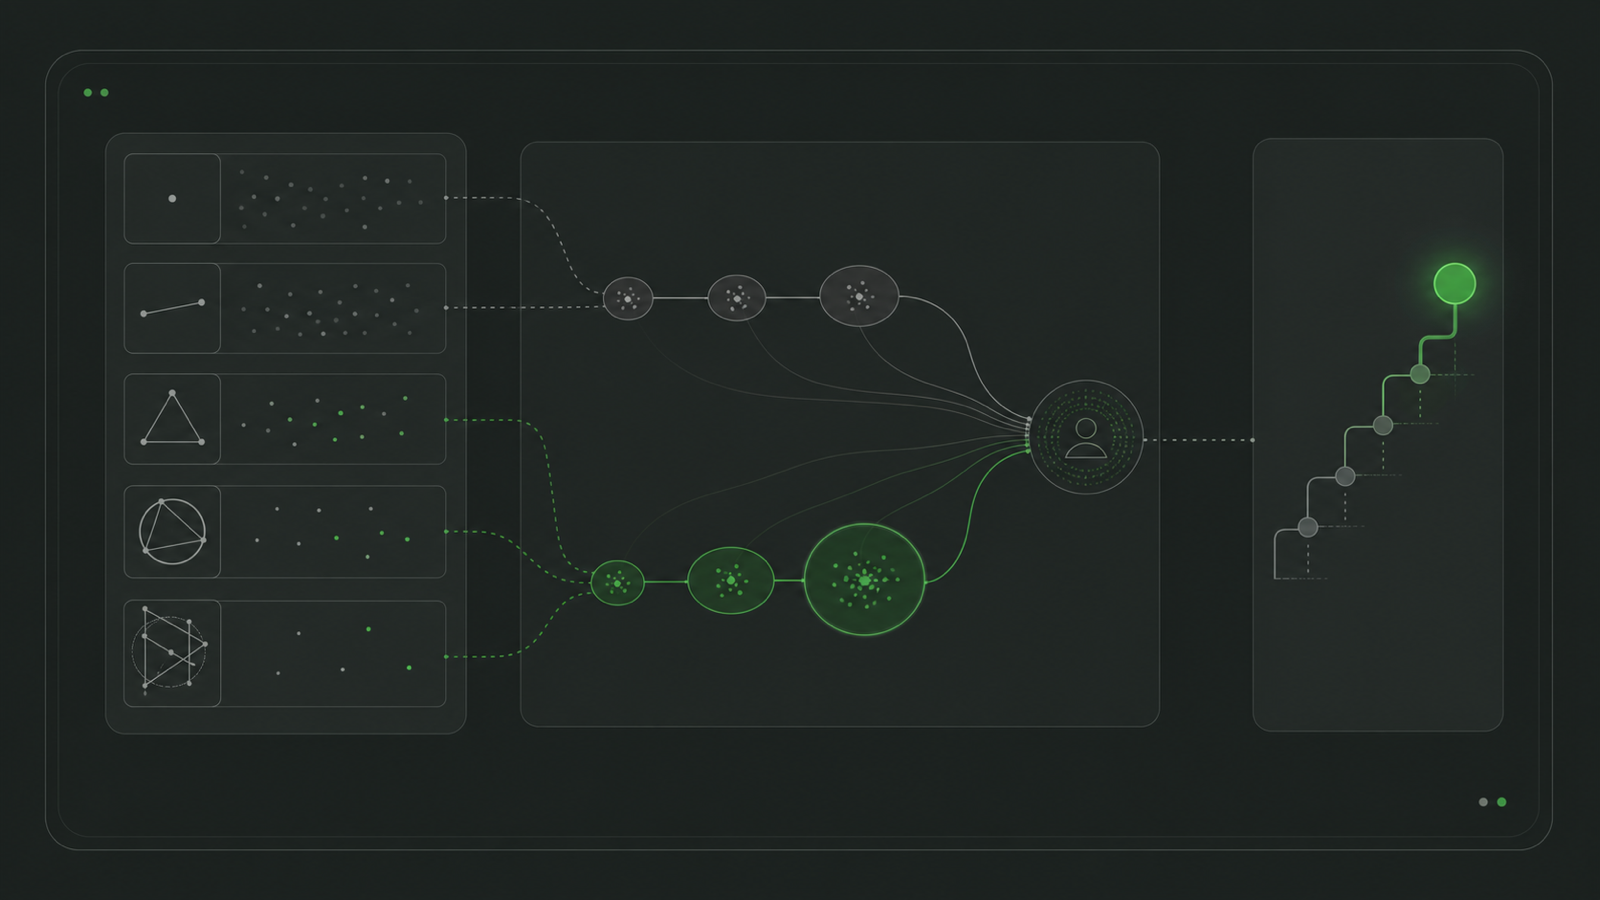
Two students can solve the same number of problems and be working at completely different levels. Our new Maths Rating measures the strength of the problems they can solve, not just the size of the pile.
Two students each solve 20 problems.
One works through the first questions of a Junior Maths Challenge paper. The other spends the same week on three late-paper problems and a proof.
A solved-count leaderboard calls that a tie.
It is not a tie.
This is the problem we have tried to solve with the new Maths Rating on Problems.cc. Weekly and monthly leaderboards still reward activity. The all-time table now measures something different: the level of problem a student has shown they can solve.
The rating is not a teacher's opinion typed into a profile. It is calculated from a versioned rating for every published problem, the student's result, and an Elo-style update after each qualifying piece of evidence.
Here is the method.
Why solved count was giving the wrong signal
Volume matters. A student who solves regularly will usually improve faster than one who appears once a month.
But volume and level are not the same measurement.
Early multiple-choice questions are designed to be accessible. A late Olympiad proof may occupy a strong student for an afternoon. Counting both as one solved problem is useful for an activity streak, but weak as a measure of mathematical level.
I see this in teaching all the time. A student can build an impressive total by staying inside a comfortable band. Another student may solve fewer problems because each one forces a new idea. The first dashboard looks busier. The second student may be making the more serious progress.
So the new leaderboards separate the questions:
- This Week ranks students by distinct non-lesson problems solved since Monday, London time.
- This Month ranks students by distinct non-lesson problems solved since the first day of the month, London time.
- All Time ranks established students by Maths Rating.
Every row shows both the relevant solved count and the student's rating state. We have not removed volume. We have stopped pretending that volume tells the whole story.
Every problem acts like a fixed-strength opponent
Elo was designed for games between players. A maths problem does not have a live rating that changes after every attempt, so we treat it as a fixed-strength opponent.
At launch, we calculated a numerical opponent rating for all 14,879 published problems in the Problems.cc catalogue. None were left unresolved.
Each stored problem rating includes:
- the numerical rating;
- the source used to calculate it;
- a confidence level;
- the components of the calculation;
- the resolver version;
- the calculation date.
That matters because a rating system should be auditable. If we improve the catalogue later, old student events keep the exact problem rating and algorithm version used at the time. We do not quietly rewrite history.
How a problem receives its rating
We use the strongest available evidence in this order.
1. Empirical or editorial calibration
An empirical calibration or a reviewed Exact Science override takes priority. These fields are stored separately from the generated catalogue, so a catalogue refresh cannot erase editorial judgement.
2. Competition and paper structure
Past-paper questions carry useful information even when they have no hand-written difficulty number.
We begin with a level-band base:
| Level band | Base rating |
|---|---|
| Primary | 700 |
| Junior | 1000 |
| Intermediate | 1300 |
| Senior | 1600 |
| Adult | 2000 |
We then add evidence from the competition and paper:
- competition difficulty stars add
0,250or550; - answer type adds
0for multiple choice,150for proof, and50for other written or numeric answers; - later paper sections add up to
400; - paper position and marks increase the rating as questions become more demanding.
For a standard 25-question multiple-choice paper, the position adjustment grows across five bands:
| Questions | Position adjustment |
|---|---|
| 1-5 | -250 to -100 |
| 6-10 | -100 to +50 |
| 11-15 | +50 to +200 |
| 16-20 | +200 to +450 |
| 21-25 | +450 to +800 |
The adjustment is interpolated within each band. Question 25 should not be treated like question 1 simply because both have five answer choices.
For proof, text and numeric papers, position adds 125 per question after the first, with 15 per available mark, capped at 900. A later section can add another 150 per section step, capped at 400.
Recognised international Olympiad problems receive a floor of 3200.
This is not pretending that paper position is perfect. It is a transparent rule for cases where the structure of the paper is the best evidence we have.
3. Editorial difficulty
If a problem has no stronger source but does have the existing editorial difficulty from 1 to 10, we use:
Here is the editorial difficulty. The formula maps difficulty 1 to 900 and difficulty 10 to 1800.
We keep the original 1-10 difficulty field unchanged. The opponent rating is a separate snapshot, not synthetic data pushed back into the editorial field.
4. Level-band fallback
If only the level band is known, we use its base rating. This is stored as low confidence so that these problems are easy to find and improve later.
Every final problem rating is rounded and kept between 400 and 4000.
The Elo calculation
Each student begins from a neutral internal prior of 1200.
That number is used for the first calculation only. A new student is shown as Unrated, not as a 1200-rated student. The optional onboarding diagnostic remains a practice placement score and does not seed the competitive rating.
Let:
Rbe the student's current internal rating;Pbe the problem's opponent rating;Sbe the result score;Kcontrol how quickly the rating can move.
The expected score is:
The update is:
The result is kept between 400 and 4000.
The K-factor becomes steadier as evidence accumulates:
| Applied rating events | K-factor |
|---|---|
| First 10 | 64 |
| Events 11-30 | 32 |
| Event 31 onwards | 16 |
Early ratings can move quickly because we know very little. Mature ratings move more slowly because one result should not erase months of evidence.
A worked example
Suppose a new student has the neutral internal prior of 1200 and solves a 1600 problem.
The expected score is:
For a correct result, and the first-event K-factor is :
The new rating becomes 1258.
If the same student had submitted a committed incorrect answer on that problem, the change would be:
The system expected the problem to be difficult for that student, so the incorrect result costs relatively little. Solving it gives strong positive evidence.
Now consider an established 1700 student on a 1300 problem. Their expected score is about 0.909. With K = 16, a correct result adds only 1, while a committed incorrect result removes about 15.
That asymmetry is deliberate. Beating a problem well below your current rating confirms what the system already expected. Missing it is new information.
Which results count
This part matters as much as the formula.
We use a fair first evidence policy:
- the first correct result on a problem scores
1; - the first soft-accepted result scores
0.75; - one committed past-paper incorrect result can score
0; - if that committed incorrect result is followed by a later correct result, the later correct result can still count;
- an interactive win counts once.
We do not update the rating for:
- repeated correct solves of the same problem;
- casual practice incorrect attempts;
- later incorrect attempts;
- unclear or incomplete evaluation states;
- lesson imports.
A student should be able to explore during practice without every rough attempt becoming a competitive penalty. A submitted past-paper answer is different. That is committed evidence.
The rating update is applied after the underlying result is saved. If rating calculation ever fails, the solve still succeeds and the rating event can be reconciled safely later.
Unrated, provisional and established
The public state is based on distinct rated problems:
| Distinct rated problems | State |
|---|---|
| 0 | Unrated |
| 1-9 | Provisional |
| 10 or more | Established |
A provisional student can see the numerical rating and progress such as 7/10 rated problems, but does not appear in the all-time rating ranking yet.
This is not a punishment for being new. It is an honest label for a number based on limited evidence.
What the rating does not claim
The rating is not an exam grade.
It does not say that a 1600 student will solve every 1500 problem. It does not measure creativity, proof-writing quality, concentration on a bad day, or how much help a student needed outside recorded platform evidence.
It is a model. Its job is to turn a large history of differently difficult problems into a more useful signal than one flat solved count.
The catalogue is versioned because the model can improve. Low-confidence fallbacks can be reviewed. Empirical calibration can replace rough metadata. New evidence can make the map sharper without changing old events behind a student's back.
That is the standard I want from a ranking system: not mystery, not false precision, but rules we can inspect and improve.
Where to see it
Open the Problems.cc leaderboard to see:
- weekly activity;
- monthly activity;
- the established all-time Maths Rating;
- solved count and rating together on every row.
Public profiles also show rating state, distinct rated-problem count and a rating timeline. New students begin visibly Unrated. Provisional students can see exactly how close they are to joining the all-time table.
Solve hard problems. Build enough evidence. Let the rating follow.