
Tier lists are loud. We built explainable rules instead — three scores, different averages for different jobs, and a full leaderboard. Bulbasaur is our worked example.
Every ranking argument sounds the same at first.
"This Pokémon is S-tier." "No, that one clears it." "Just look at the stats."
Tier lists, FIFA ratings, game meta charts, playground debates about the best starter — teenagers live inside ranking culture. The opinions are loud. The rules are usually missing.
In a recent group project we tried something different. A student picked Bulbasaur. Not because he thought Bulbasaur would win. Because he wanted a fair answer to a fair question:
Where does Bulbasaur actually rank — and can we explain why?
Not vibes. Not nostalgia. A model with rules we could defend.
His stats look fine — until you compare
Bulbasaur's base stats:
| Stat | Value |
|---|---|
| Attack | 49 |
| Special Attack | 65 |
| HP | 45 |
| Defense | 49 |
| Special Defense | 65 |
| Speed | 45 |
Add them up and you get 318. That feels tidy. It is also a trap.
Different stats do not live on the same scale. HP can go much higher than Attack. A single total hides what is actually strong and what is actually weak. This is the same conversation we have in class when we work on Sums and Averages: the average you choose matters.

How we compared him fairly
We scored 1,350 Pokémon variants with the same rules. For each stat we asked a simple question: where does Bulbasaur sit compared with everyone else?

The picture is blunt.
- Attack, HP, Defense, and Speed — weak (bottom quarter)
- Special Attack and Special Defense — below average, but not terrible
So Bulbasaur is not awful everywhere. He is uneven. That is already more useful than shouting "mid."
Three components in our notebook model
Six numbers are still a lot. In our Jupyter notebook we boil them down to three components — each with its own job and its own way of combining stats.

Component 1 — Attack power
This is about how hard Bulbasaur hits. We combine Attack and Special Attack, but we count his better attack side more — a bit like picking your strongest subject when you form a team. Different averages for different jobs is exactly what we talk about in Sums and Averages.
Bulbasaur's Special Attack is okay. His physical Attack is weak. The model leans toward the better side, but both are still below average — so attack power lands at 39.3. That is his least bad axis.
Component 2 — Toughness
This is about how hard he is to knock out. We combine HP, Defense, and Special Defense.
Here we use the geometric mean — the same family of idea as AM–GM inequalities, which we study in class. Why? Because one terrible stat should drag everything down.

Take 2, 2, and 50 in class: the ordinary average is 18, but the geometric mean is about 6. One tiny value pulls the team down hard.

Bulbasaur's HP and physical Defense sit in the bottom quarter of all Pokémon. His Special Defense is only below average. The geometric mean still punishes him — exactly like a group project where one person does no work. That is why toughness is only 21.9, not somewhere in the middle.
Component 3 — Speed
Speed is one stat and one comparison. No extra formula — we just ask where Bulbasaur's Speed ranks against everyone else.
He is in the bottom quarter. Speed: 22.0.

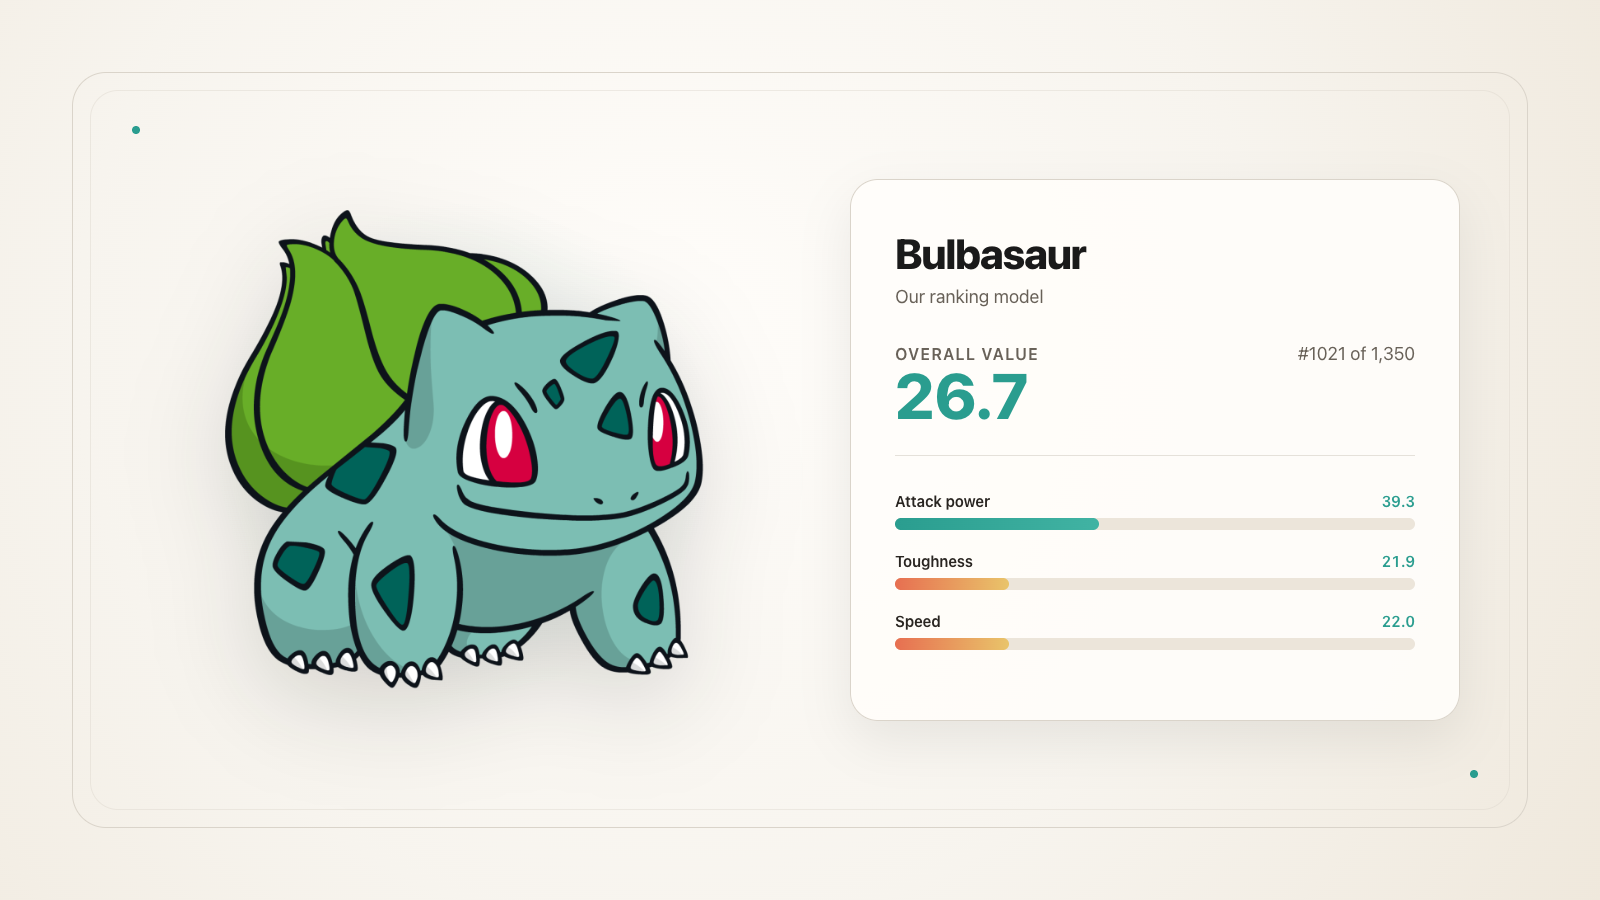
Bulbasaur's final value: 26.7
When we need one headline number, we take the geometric mean of the three components — equal weight, same "one weak link drags it down" logic as toughness.
Overall value: 26.7 out of 100
Rank: #1021 out of 1,350
That is bottom quarter on this model. Not useless — just not a stat monster.
Evolution tells the same story in a way everyone understands:

| Form | Overall value |
|---|---|
| Bulbasaur | 26.7 |
| Ivysaur | 43.7 |
| Venusaur | 66.5 |
Same rules. Better numbers every step. No nostalgia bonus.
What the model does not know
We were strict about this.
The score only sees base stats. It does not know:
- typings or resistances
- moves like Sleep Powder or Leech Seed
- abilities, items, or matchups
- whether you love Bulbasaur because he was your first starter
A low score here does not mean "bad Pokémon." It means weak on the things we chose to measure.
That honesty is the point. Real models say what they include — and what they leave out.
Explore the 3D map
We built an interactive map of all 1,350 Pokémon in attack-power / toughness / speed space. Bulbasaur starts highlighted in gold. Spin it, zoom, click other dots to compare.
This is the kind of data project we do in class now: a question, a dataset, a model you can argue with, and a chart you can explore — not a black-box tier list from the internet.
Full rankings
Want the whole leaderboard? We exported every result from the same model.
Download full rankings (CSV) — all 1,350 variants with stats and scores.
Top 20 by overall value:
| Pokémon | Overall |
|---|---|
| Eternatus Eternamax | 94.0 |
| Mewtwo Mega X | 93.2 |
| Rayquaza Mega | 91.7 |
| Necrozma Ultra | 91.5 |
| Arceus | 91.2 |
| Zacian Crowned | 90.3 |
| Mewtwo Mega Y | 89.7 |
| Salamence Mega | 89.6 |
| Koraidon | 88.9 |
| Koraidon Limited Build | 88.9 |
| Koraidon Sprinting Build | 88.9 |
| Koraidon Swimming Build | 88.9 |
| Koraidon Gliding Build | 88.9 |
| Garchomp Mega Z | 88.5 |
| Miraidon | 88.2 |
| Miraidon Low Power Mode | 88.2 |
| Miraidon Drive Mode | 88.2 |
| Miraidon Aquatic Mode | 88.2 |
| Miraidon Glide Mode | 88.2 |
| Palkia Origin | 88.2 |
Built in a Jupyter notebook during the project. If you want to run your own version — different weights, different favourite Pokémon — that is exactly what our group lessons are for.
For solo practice between sessions, problems.cc is full of questions that reward the same habit: stop guessing, start structuring.